Patient Heart Rate in Relation to Illness
Hello! This page was designed to inform you about how heart rate variability and speed (bpm) relates to illness, including cardiovascular disease and viral conditions.
Web Resources
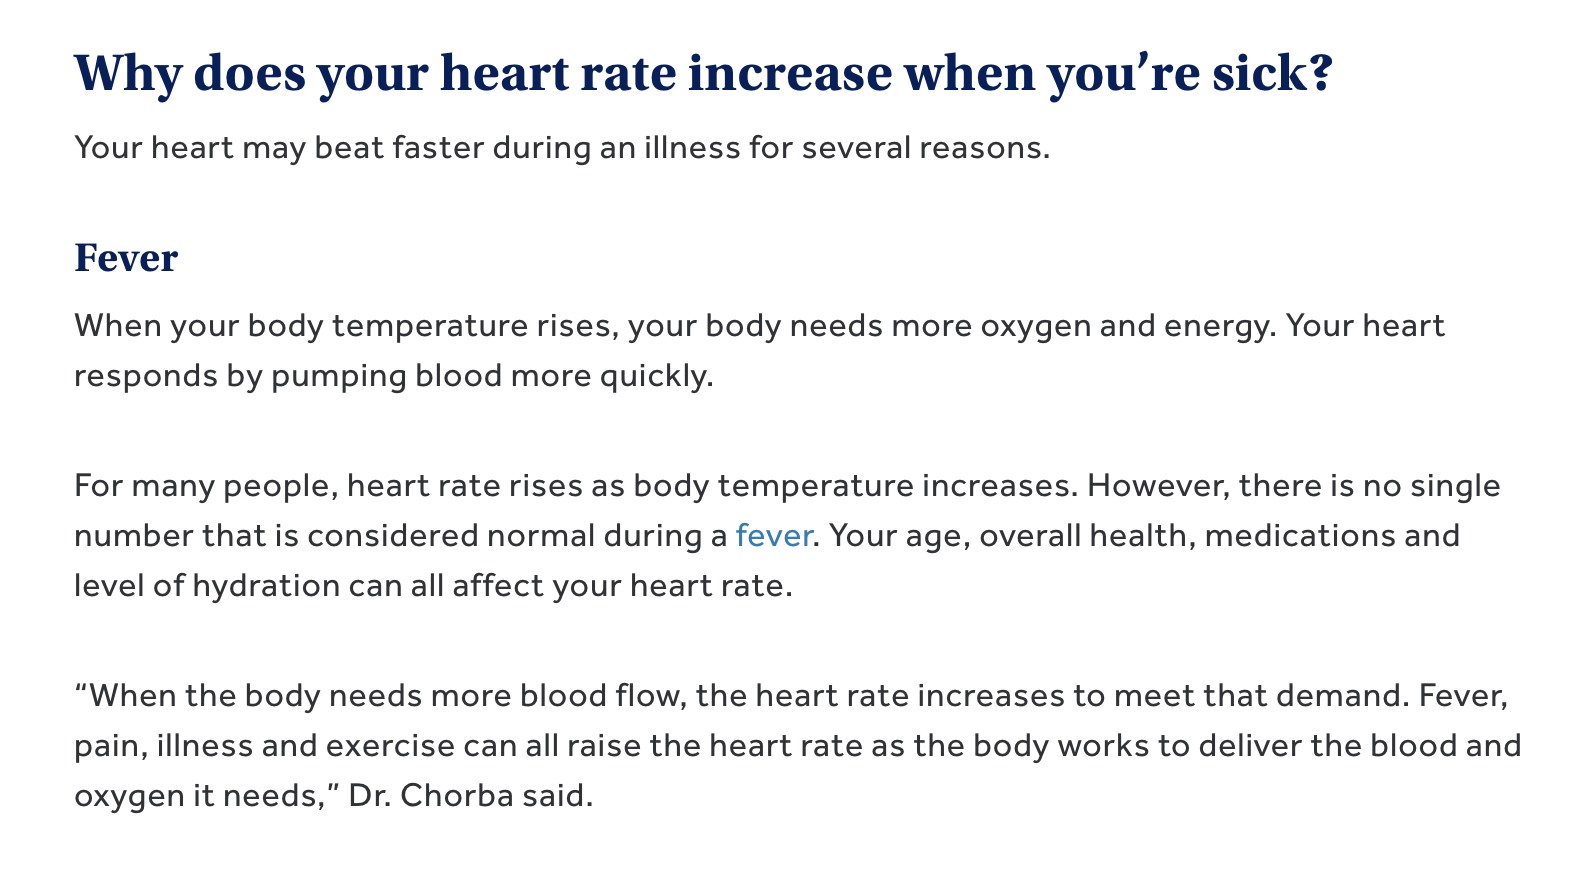
Paragraph explaining why pulse increases when sick.
 This article from Banner Health expands on why heart rate increases during sickness. It explains that the heart must work harder to transport energy and oxygen around the body.
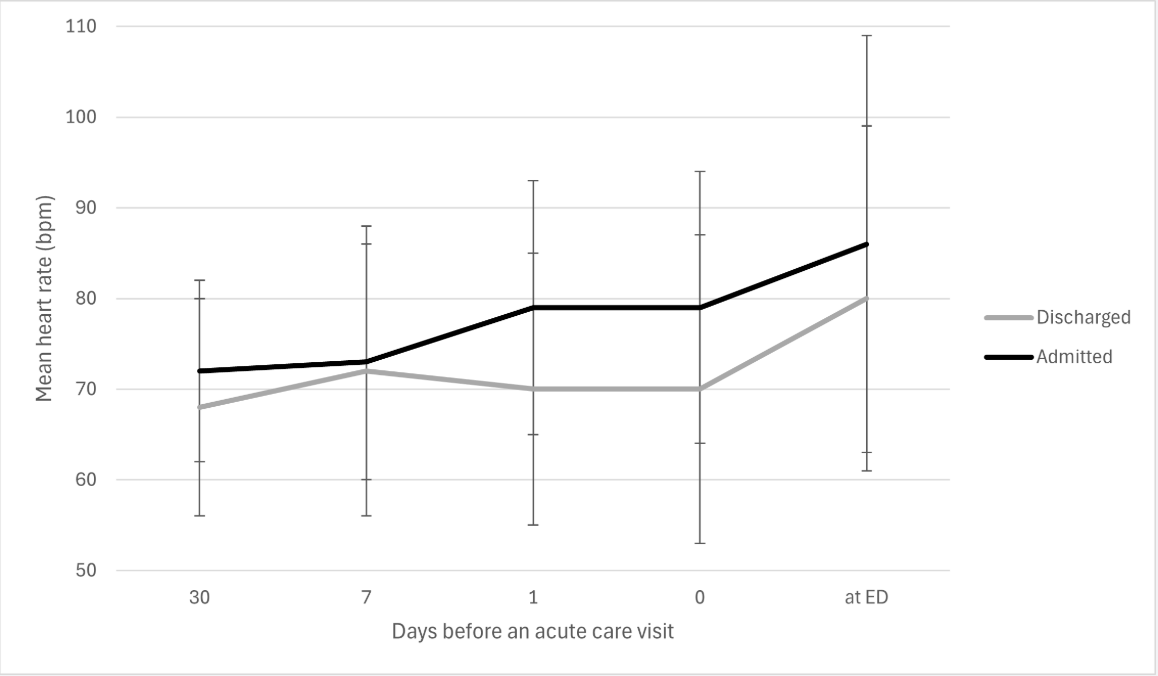
Line graph demonstrating heart rate before an acute care visit, comparing admitted and discharged patients.
 This journal from JMIR investigates the ability of fitness trackers and like devices to detect abnormalities in vital signs in the days leading up to an acute hospital visit.
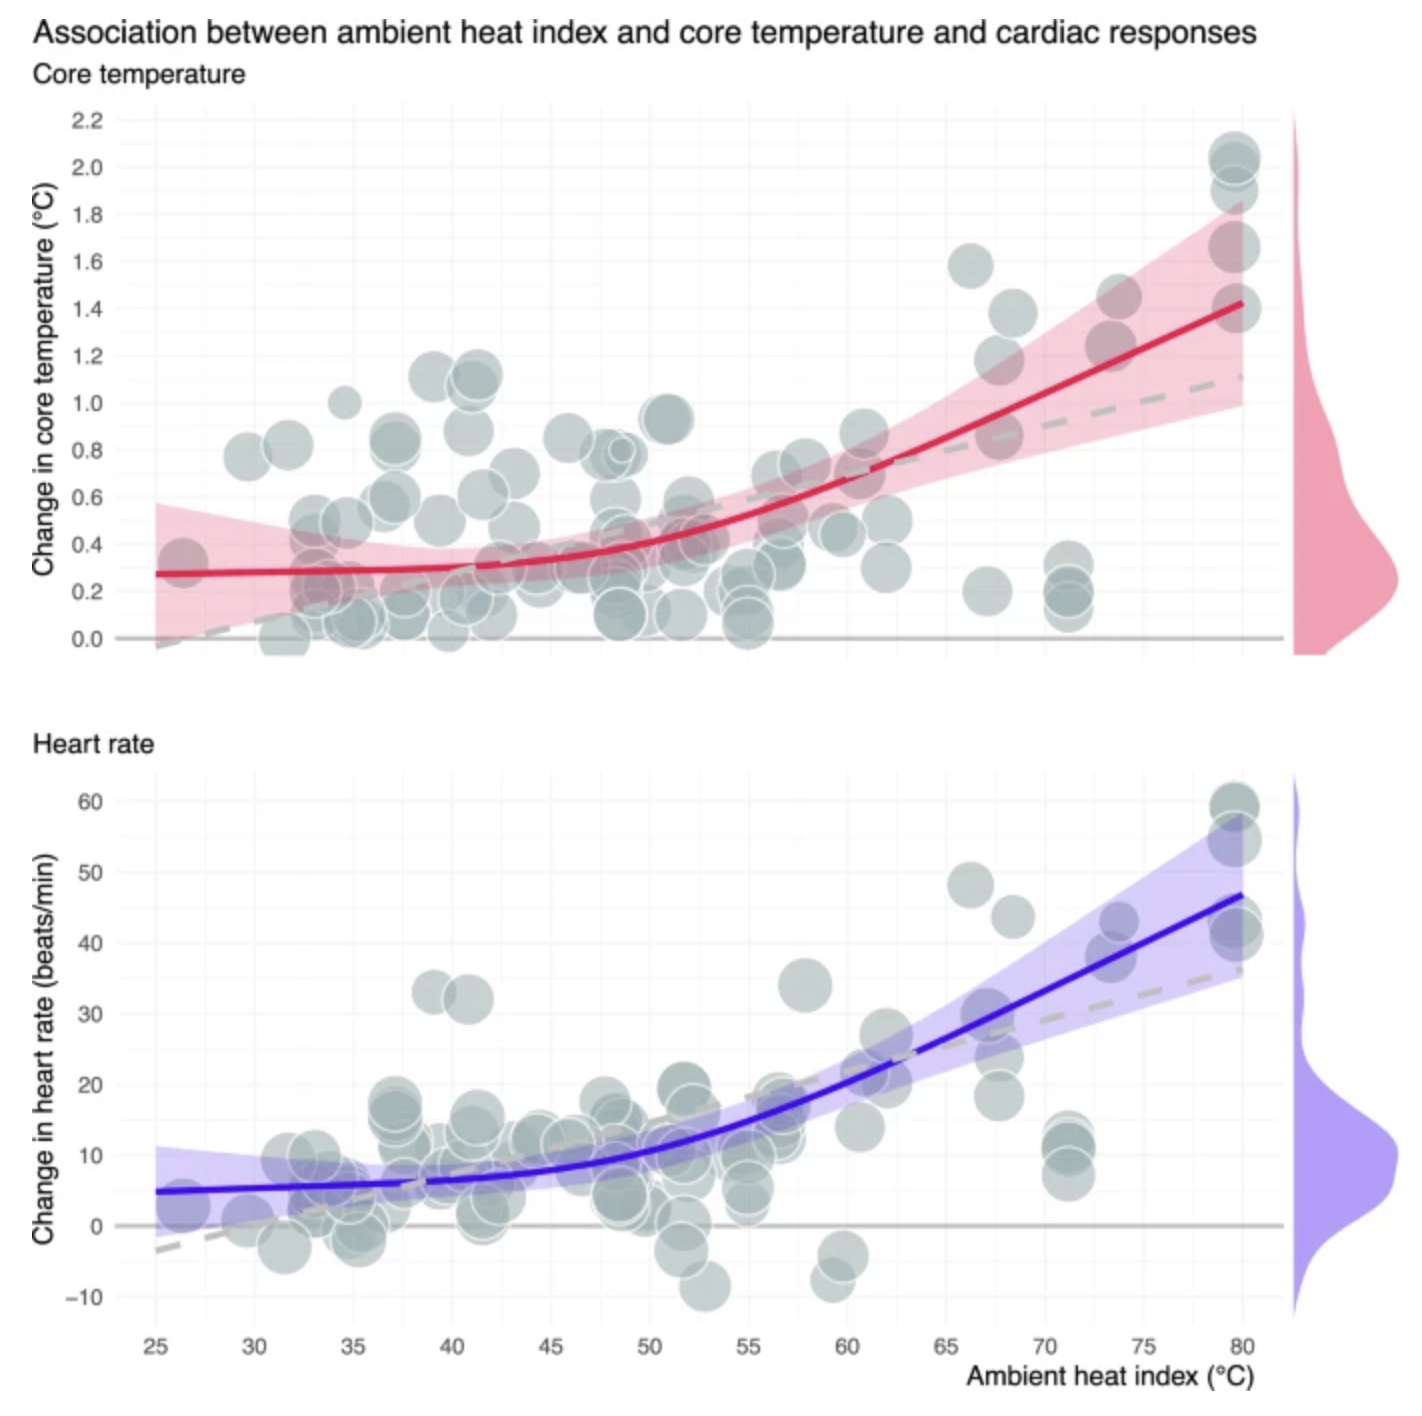
Data demonstrating relationship between environmental temperature, core temperature, and heart rate
 This article from Nature.com performed a study on the relationship between heat, body temperature and heart rate.
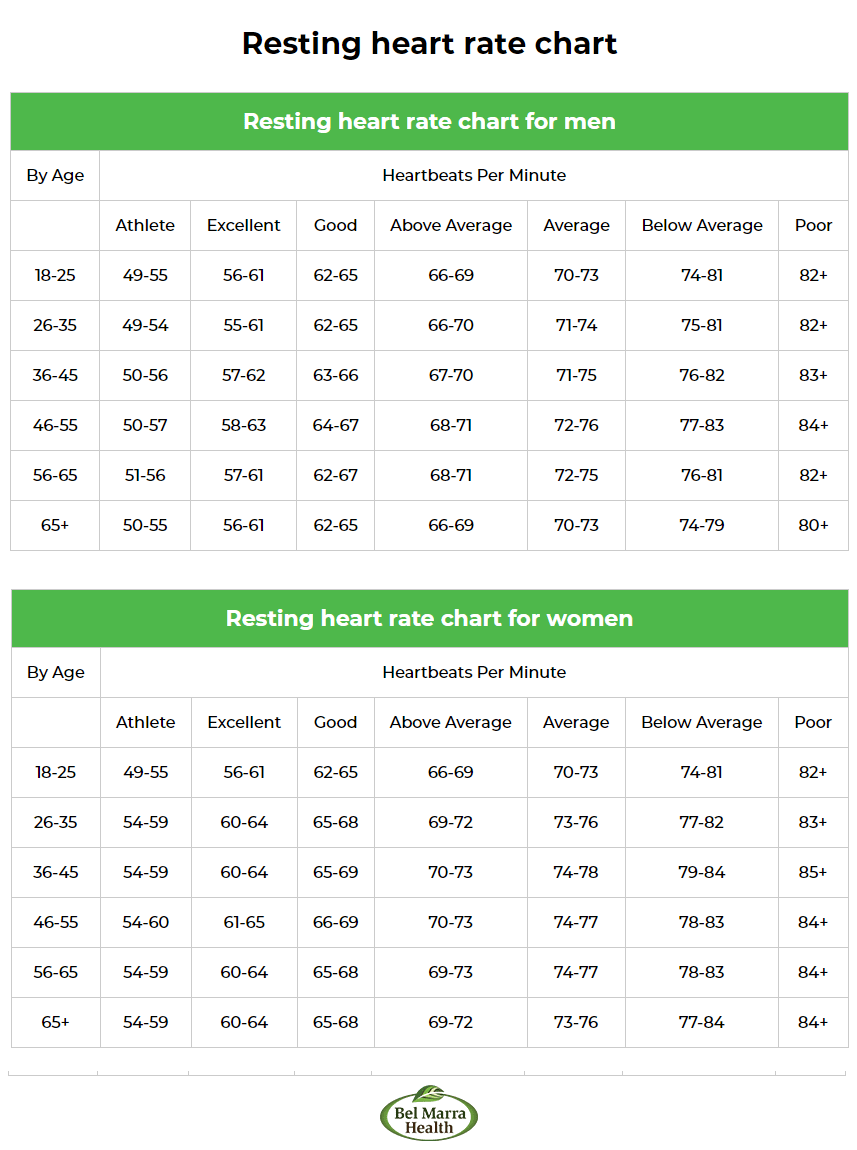
Chart displaying typical resting heart rates by age and sex.
Graphics, charts, and guidelines about typical heart rate range based on age and sex, such as this one from
 Bel Marra Health
How or why would I use this data?
- Curious about your own heart rate? See how to calculate it in the Banner Health article under "How can you check your heart rate?", and then compare it to the chart provided in the final box according to your age and gender.
- Why does your heart beat faster when you're sick or exercising, and why does your temperature increase? Look at the analysis performed by Nature Communications and review the graphs provided to gain a deeper insight into their relationship.
- Smart watches and other fitness devices can actually provide warning signs/trends and, in some cases, predict medical emergencies. Read more in the study from the journal JMIR.
Drawing Insights Example
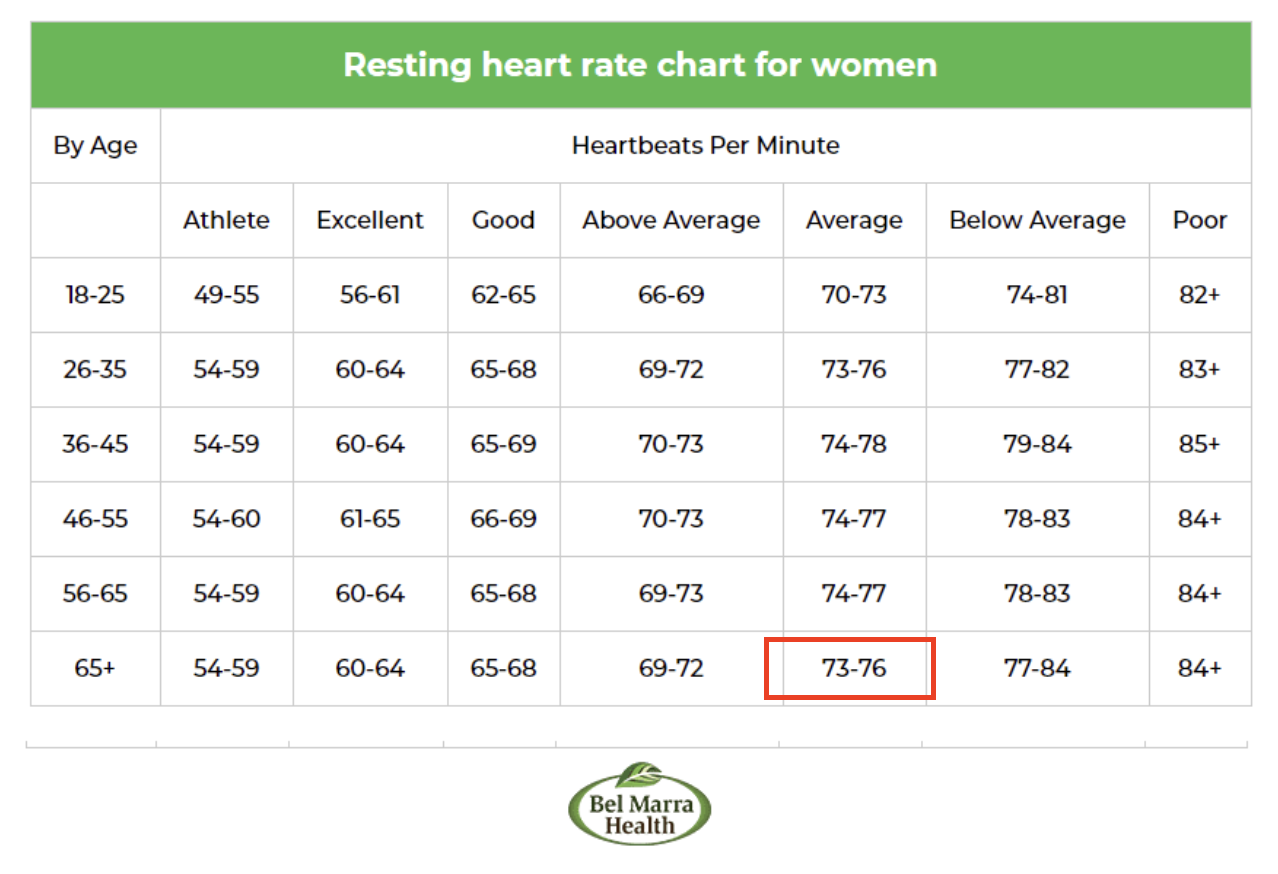
Bel Marra Health, Dr. Victor Marchione. The red box indicates where this person generally falls in terms of fitness.
In this scenario, let's imagine an elderly person who is suspected to have an underlying health condition. The person is 73 years old and female, and regularly wears a smart watch. According to the watch data, her average resting heart rate is typically around 73-77 beats per minute (bpm).
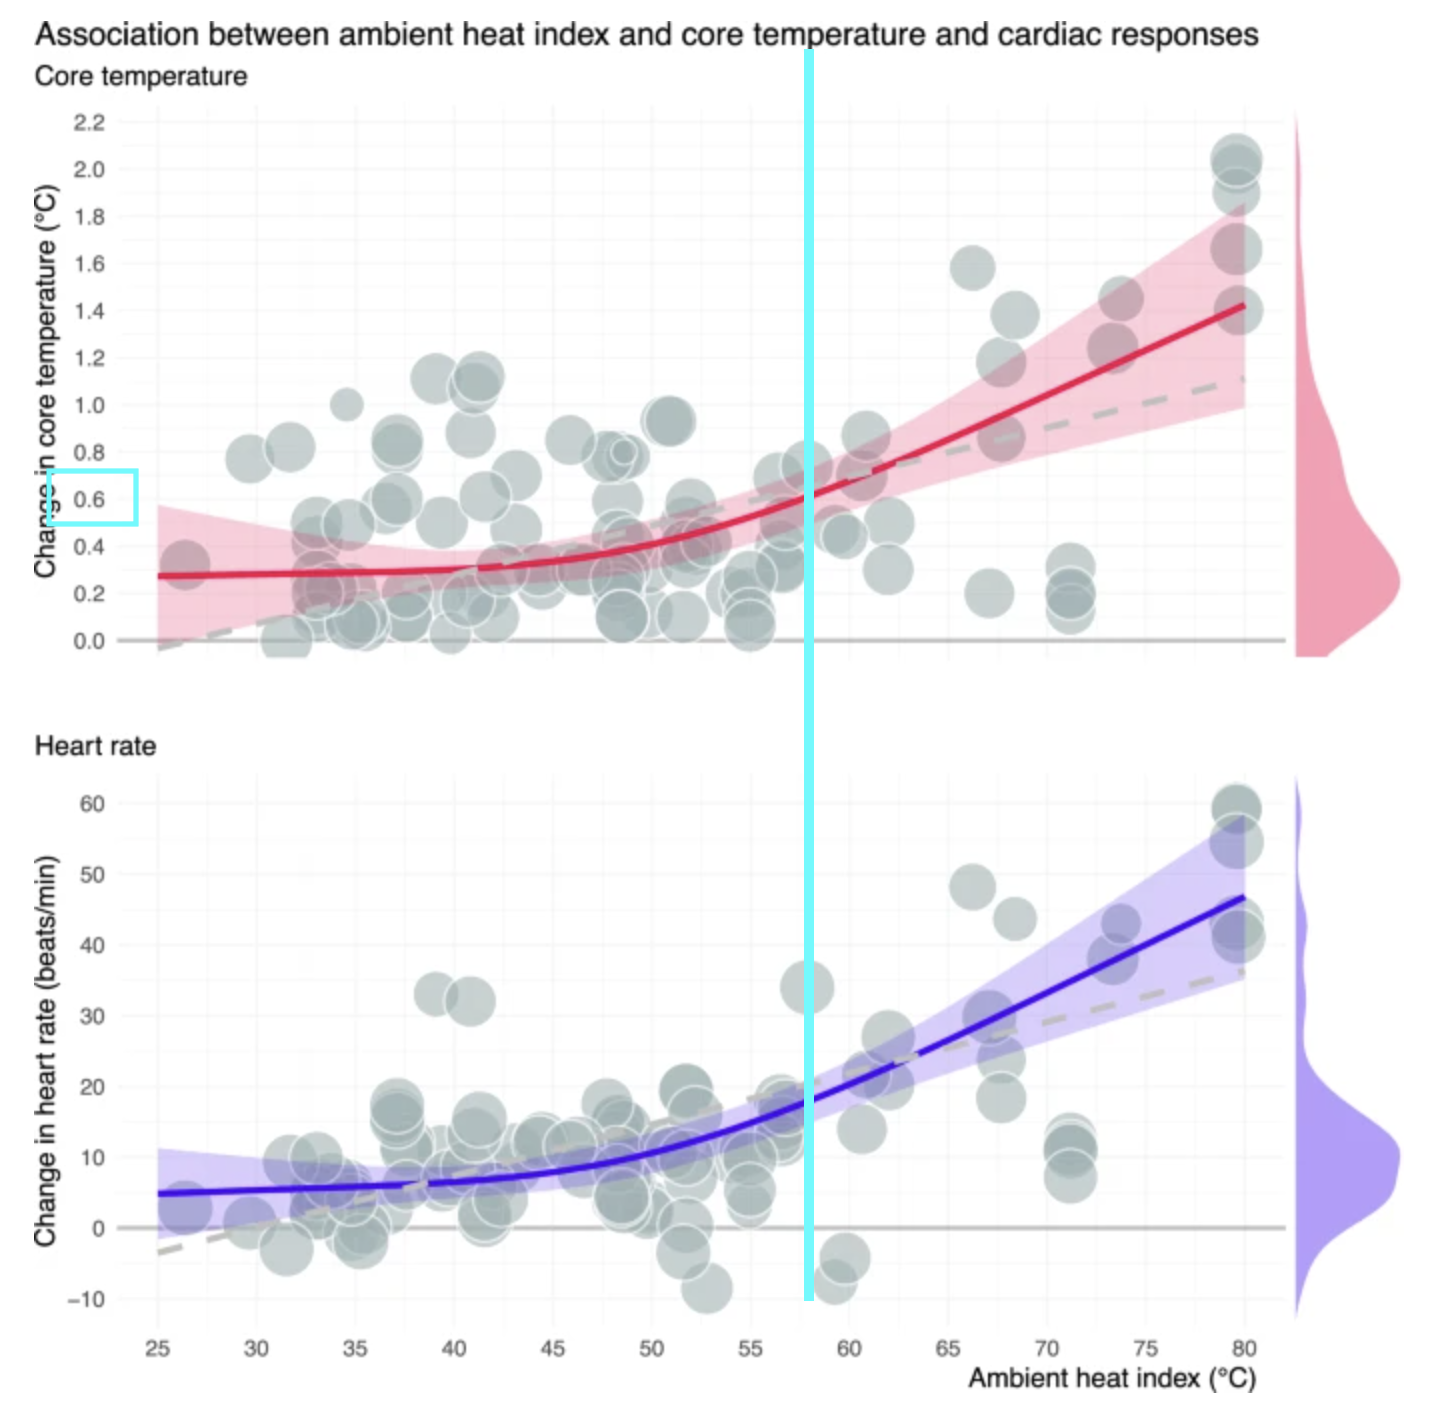
Nature.com, Meade et al. The aqua line on the graph demonstrates her increase in temperature (degrees Celsius) and where it corresponds with the heart rate.
One day, she comes down with an illness and her family decides to check her smart watch data. On the third day of the illness, her resting heart rate is 80 bpm, significantly above her average. Looking at the chart, this resting heart rate appears to be categorized as "Below Average" fitness, but she has not changed her routine significantly since the illness developed. They also take her temperature, which usually averages around 98.6 degrees Fahrenheit; however, it is currently 99.8 degrees. Looking at the graph from the Nature research, her higher heart rate makes sense given the upward trend with temperature and heart rate. This is likely because of the illness raising body temperature.
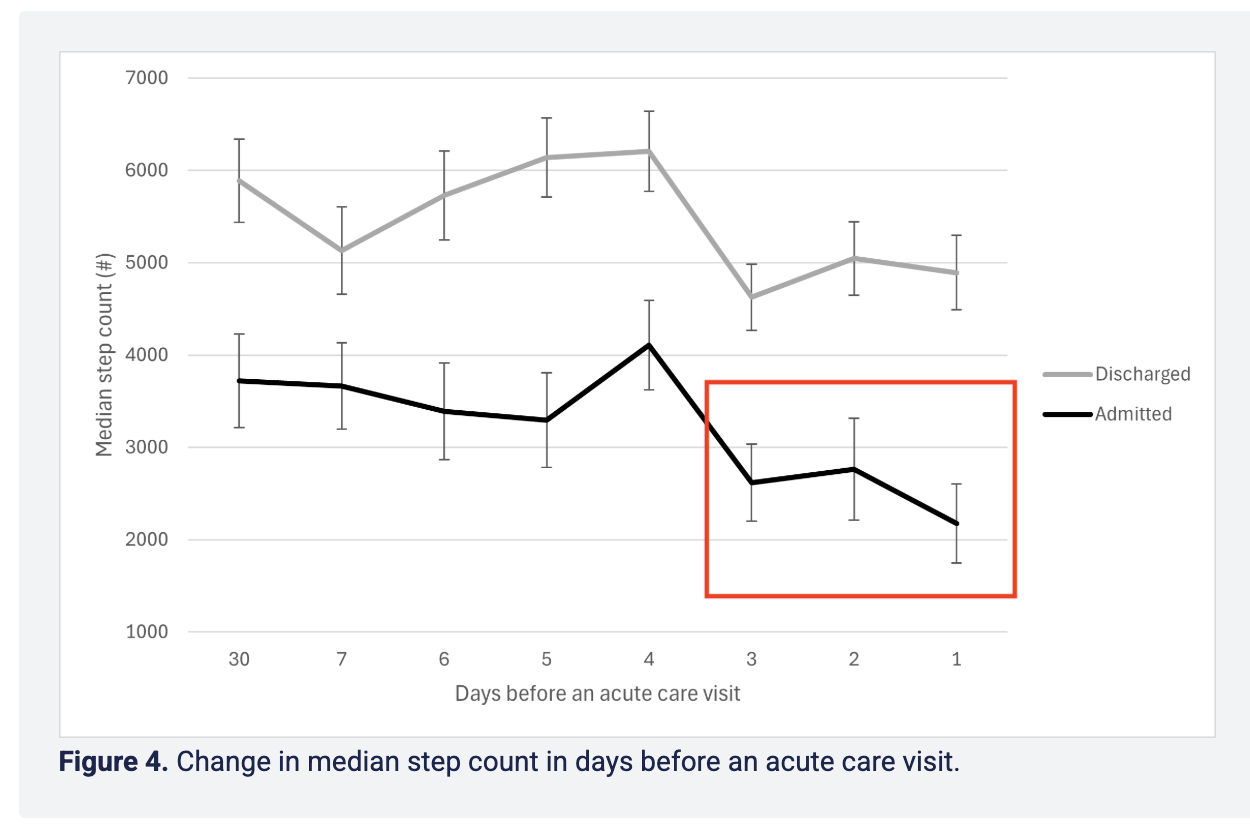
JMIR Cardio, den Dujin et al. This red box shows how in the days prior to an acute care visit, daily steps drop drastically. This correlates with a slight increase in resting heart rate.
Concerned, the family takes a closer look at trends in her other vital signs. Over the past month or so, her resting heart rate has risen almost imperceptibly, but definitely risen since the last month. She has also been walking slightly less than usual over the past week, and has recently reported mild pain unrelated to her illness that she previously thought should be ignored. Upon looking at the graph in the journal article by JMIR, it was found that admitted patients wearing health trackers typically experienced a slight increase in heart rate as well as a decrease in steps in the days leading up to an acute care visit. Out of caution, she and her family agree to get herself checked out at the hospital just in case; they later discover that she has a condition more serious than only a fever.