Marching Band Data 3A 2026


School Overall Penalties Total Auxiliary Percussion Last Comp. Time Gap (days)* Overall Change**
1 Westlake HS Regiment 75.100 0.00 75.100 80.00 71.50 Oct 31 7 6.200
2 University City HS 74.800 0.00 74.800 66.50 73.50 Oct 31 28 11.600
3 Valencia HS 74.400 0.00 74.400 80.50 69.00 Oct 31 7 0.600
4 El Camino Real HS Royal Regiment 70.400 0.00 70.400 69.50 70.50 Oct 17 -- --
5 Covina HS Marching Band and Color Guard 68.300 0.00 68.300 68.50 64.00 Oct 27 17 4.700
6 Cathedral City HS 68.200 0.00 68.200 67.00 65.00 Oct 24 14 5.100
7 Chula Vista HS 67.900 0.00 67.900 57.00 70.00 Oct 28 -- --
8 San Marcos HS (Santa Barbara) Marching Band & Guard 67.600 0.00 67.600 64.50 65.50 Oct 24 7 0.800
9 Oak Hills HS Bulldog Brigade 66.800 0.00 66.800 68.50 73.00 Oct 24 14 5.300
10 Gabrielino HS Eagle Marching Regiment 66.600 0.00 66.600 67.00 62.00 Oct 24 14 8.700
11 Patriot HS Cardinal Regiment 66.500 0.00 66.500 69.50 68.00 Oct 24 14 7.300
12 Dos Pueblos High School Marching Chargers 66.300 0.00 66.300 71.00 67.50 Oct 24 14 5.500
13 Eastlake HS 66.200 0.00 66.200 67.00 74.50 Oct 28 4 5.200
14 Steele Canyon HS Steele Regiment 65.600 0.00 65.600 60.00 69.00 Oct 24 14 1.100
15 West Covina HS Bulldog Band & Colorguard 64.900 0.00 64.900 75.00 66.50 Oct 31 28 11.100
16 Taft Charter High School Marching Toreadors 64.900 0.00 64.900 65.00 62.50 Oct 24 14 3.400
17 Monrovia HS Marching Wildcats Band & Color Guard 64.800 0.00 64.800 62.50 64.50 Oct 24 7 1.500
18 El Camino HS Golden Pride 62.900 0.00 62.900 59.00 64.50 Oct 24 21 7.400
19 Castle Park HS Trojan Brigade 61.600 0.00 61.600 48.00 57.00 Oct 28 4 4.200
20 Mark Keppel HS Aztec Band and Color Guard 60.700 0.00 60.700 57.50 56.00 Oct 24 -- --
21 Tustin HS Marching Band 60.600 0.00 60.600 61.50 58.50 Oct 24 7 -1.300
22 Redlands East Valley HS Marching Wildcats 59.000 0.00 59.000 64.00 61.00 Oct 24 14 4.700
23 Hoover HS Marching Cardinals 58.800 0.00 58.800 52.00 61.50 Oct 24 21 12.200
24 El Capitan HS 58.500 0.00 58.500 63.00 53.50 Oct 10 -- --
25 Hueneme High School Viking Vanguard 57.700 0.00 57.700 51.50 59.50 Oct 31 21 0.700
26 Patrick Henry High School Marching Patriots 57.500 0.00 57.500 55.00 58.50 Oct 24 21 12.700
27 Lompoc High School Marching Braves and Danceline 57.400 0.00 57.400 45.00 62.00 Oct 10 -- --
28 Santee HS Falcon Marching Band & Color Guard 55.700 0.00 55.700 52.00 45.00 Oct 24 14 9.400
29 Montgomery HS 55.200 0.00 55.200 46.00 50.00 Oct 28 -- --
30 AB Miller High School Marching Band 55.100 0.00 55.100 62.00 64.00 Oct 31 28 7.000
31 Highland HS (Palmdale) Marching Band & Color Guard 54.100 0.00 54.100 43.00 63.50 Oct 17 21 12.300
32 Yorba Linda HS 51.700 0.00 51.700 46.50 46.00 Oct 10 -- --
33 Azusa HS Regiment & Pageantry Corps 51.600 0.00 51.600 58.00 56.00 Oct 27 -- --
34 Venice HS 49.600 0.00 49.600 48.00 49.00 Oct 17 7 6.600
35 Torrance HS 48.900 0.00 48.900 44.50 51.00 Oct 3 -- --
36 Colton HS 47.300 0.00 47.300 44.50 54.00 Oct 31 35 6.700
37 Knight Hawk Regiment 38.400 0.00 38.400 39.00 46.00 Oct 24 7 -9.000

*Time Gap is the time elapsed, in days, between the most recent competition and the one before that.

**Overall Change is the total points gained or lost from the Overall score between the most recent competition and the one before that.


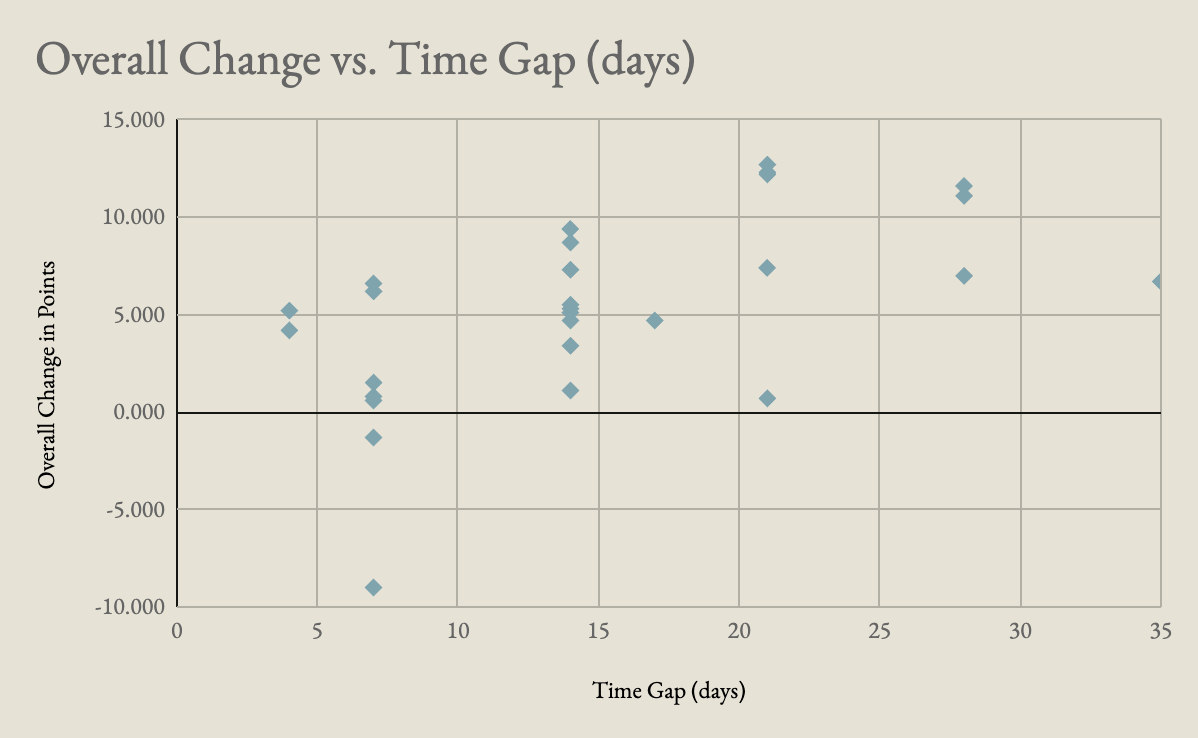
chart 1

This chart displays the differences in points gained or lost between the most recent competition and the competition before that, measured in days between competitions. There appears to be a general upward trend as the number of days increases. On the contrary, there is a wide variation in point change for teams that have the same gap, meaning that there is little to no correlation between point change and time between competitions. Therefore, competing four days after the last competition does not guarantee a significantly larger point difference than if a school were to compete 21 days later.
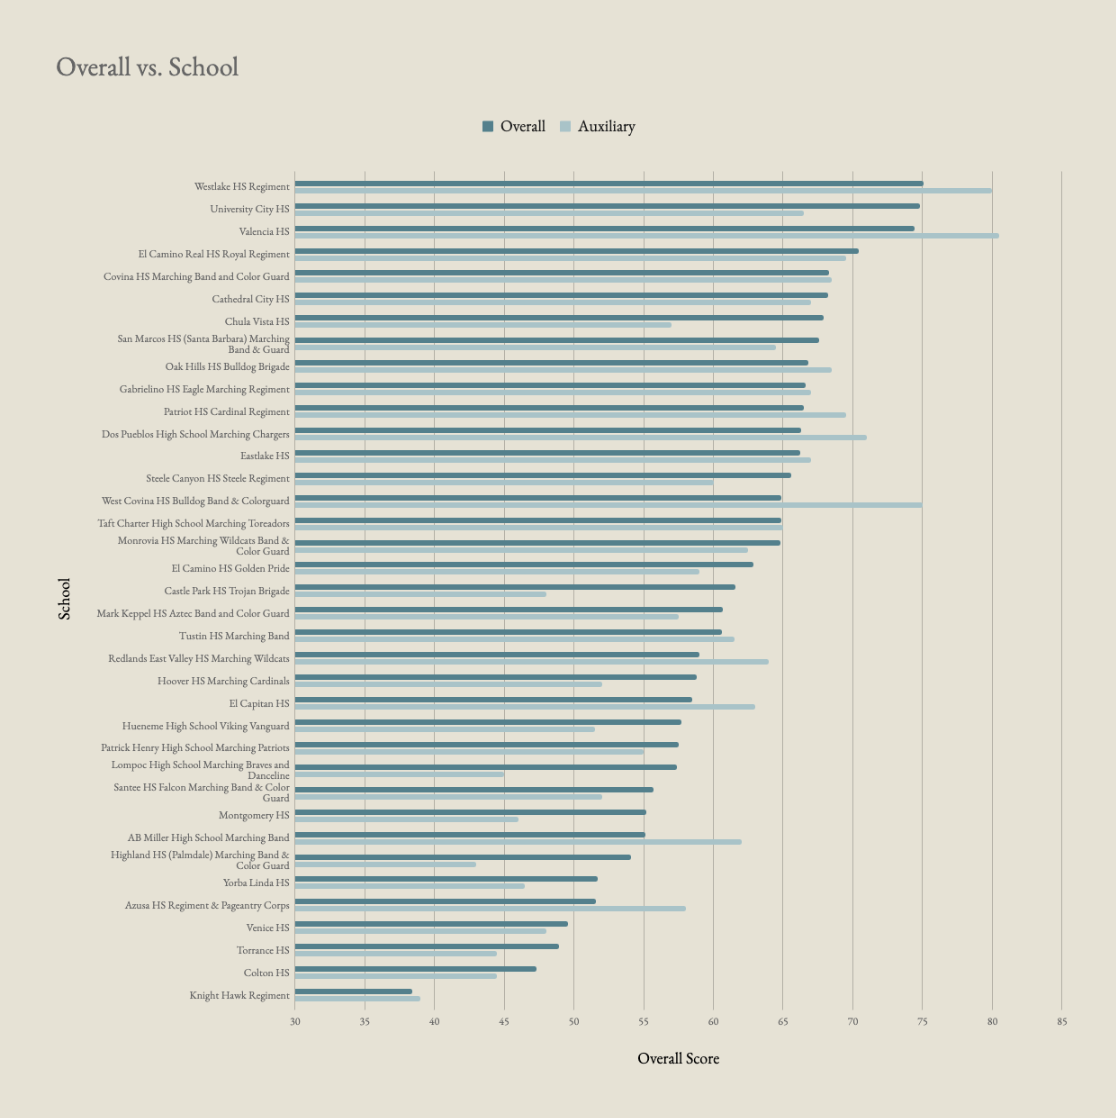
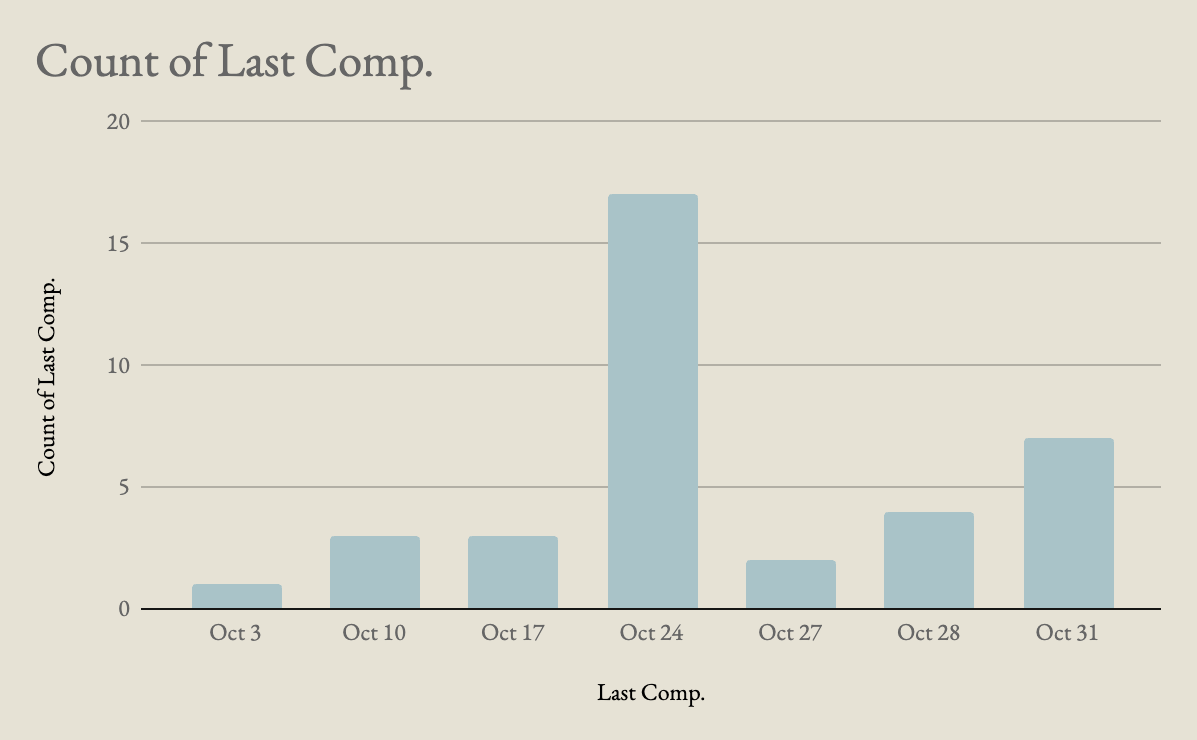
chart 2

This chart shows the comparisons of the 37 participants' overall scores versus auxiliary scores. The data is ordered by overall score, from highest to lowest. Although some of the auxiliary scores vary significantly compared to their overall scores- for instance, West Covina's auxiliary score is about 10 points more than their overall- they still follow a gradual increase corresponding with the Overall score. This trend demonstrates how performance is determined by the individual school's program.


chart 3

In this final chart, there seems to have been a lot of teams who last performed on October 24 and have not performed since. Despite this, the point differences between teams are very small as shown in chart 2, and there are no sharp increases or decreases other than Knight Hawk Regiment, a statistical lower outlier. There are no upper outliers. In the data, the October 24th competitors are distributed fairly evenly throughout the dataset. This further supports the argument that the date at which a school performs does not place them at an advantage or a disadvantage.


This all goes to show that the timing of when a school performs only minorly affects their overall placement, if at all. Ultimately, it is the quality of the program itself that determines how well a team will do. The band, Auxiliary, and Percussion have different scores because they often train separately and are taught by different people. Sometimes external circumstances affect a program's ability to function and it is out of the school's control. Numbers and trends can only do so much, but in the end it's really the preparation, practice, and training that counts.